Self-publishing sales 2016
First things first: Happy New Year to one and all! 😀
Now that’s out of the way, it’s time to delve into some sales figures. I have done this twice before, in 2013 and 2014, but skipped last year for no particular reason I can remember. I like to do this because there isn’t that much honest information out there for self-published creators into the reality of how it works and what actual sales and income look like.
Because I missed last year, I thought I would do a run-down of the last (first) four years of my self-publishing journey, along with a few hints and tips about things I’ve discovered along the way.
So, here’s the graph of sales per year:
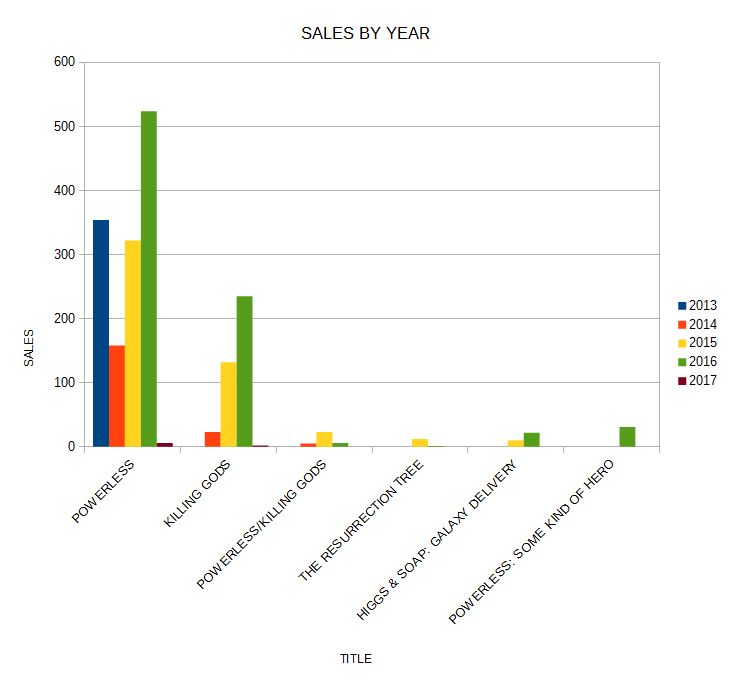
As you can see, there’s an upward trend, with only a handful of things to point out:
- The drop in Powerless sales from 2013 to 2014 was because at this time it was selling for full price (£3.99 if I recall), and I only dropped it down to 99p after the sequel Killing Gods came out in early 2014. I think this drop was partly due to sales fatigue at that higher price, combined with the fact it was a standalone book at that time (people less likely to pay that much if not part of a series) and the fact that prices seemed to be starting to drop overall in 2013/2014 across Amazon and the whole ebook world.
- Powerless/Killing Gods is a combined ebook of the two books, and I never expected it to sell huge numbers as it was more an experiment in creating another line of income. Interestingly, this sells mostly on the Apple bookstore and Barnes & Noble in the USA, as opposed to Amazon.
- Whilst The Resurrection Tree and Higgs & Soap have low actual sales, I have used free promotions on Amazon to “sell” 640 and 214 copies of them respectively. And because they’re exclusive to Amazon now, what this means is that the moment any of these 854 people start reading, I start getting paid per page read. And luckily for me, most people tend to read cover to cover – especially Higgs & Soap – which equates to a bit more than a full sale.
- Quite pleased that my comic, Some Kind of Hero has sold decent numbers on both Amazon and ComiXology. You never know how these things will go, especially for a one-shot story that’s tied into a line of books! I’ll be promoting it more this year and we’ll see how it looks in next year’s graph.
All very interesting I’m sure, but you want to know about the money! So here we go:
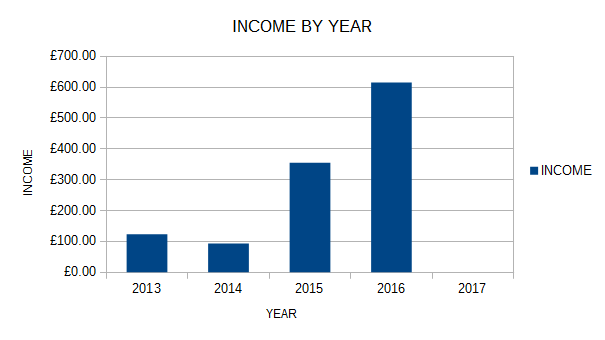
Almost made enough for my solid gold yacht! However, this year is rubbish 🙂
I’m a little premature here, given that my Amazon payment for November isn’t due until the end of this month, but expect that 2016 column to go up by another £30-£40 or so. FYI, the 2014 dip in sales matches the drop in Powerless sales and low initial Killing Gods sales, which I’ve talked about above. But to be honest, it isn’t the most interesting graph, it’s this one:
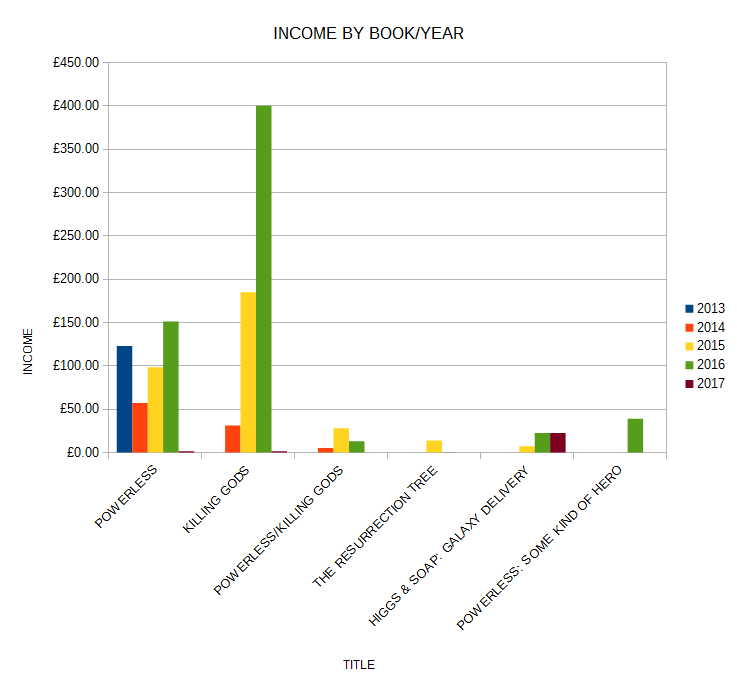
This is how much each book brought in per year. Powerless was full price for 2013, then dropped to 99p for 2014 onwards, so no big surprise it’s not raking in the money. However, while Killing Gods was slow to start (coming in and staying at full price) as more people picked up the first book, more went and dropped cash on the sequel. At 99p, over 1400 people have so far gambled on Powerless, and over 400 on Killing Gods, which means (ignoring those who just bought the second book alone) there’s around another 1000 people who haven’t bought the sequel yet. Now some of those might have read the first one and genuinely aren’t interested in continuing, but there will be a number who are maybe holding off the sequel for now and an even larger number who haven’t even read the first one they bought yet.
It’s well known that Kindle readers will readily drop 99p/99c on an ebook and have a massive digital pile of titles to-be-read.
It’s also well known now that if, as an author, you have a book series, selling the first book at 99p/99c or even giving it away free will greatly encourage sales of the sequels. Give readers an “easy in” to your books, and if they like it, then you’ve got someone who might pick up the sequels. If they don’t like it, they’ve only spent less than a pound, so no great loss for anyone involved. And as it is, my graph above seems to bear this out.
Oh, and as for sales per channel, I’m not going to show the graph for that as it is so skewed, but Amazon netted 1114 sales in total with 15 for iTunes/Apple and 16 for Barnes & Noble, which is a similar pattern to previous years.
The truth of the matter is that self-publishing is a long game. Don’t quit your day job to finish that novel expecting to replace your salary when you release it. You won’t. You have to be prepared to keep promoting, keep bringing out new material, keep at it for years to start to see that upward trend turn into something that can support you.
To be honest, looking at that final graph, I should be banging out the third book in the series right now rather than working on a graphic novel! So that’s my plan after The Murder Club is released – to finish and publish book #3.
Hope this has been useful for you. Feel free to add your own info, or ask questions in the comments below and I’ll answer as best I can.
Tony.